Our method: measure, act, re-measure.
Concretely: you do a first assessment with advanced tests. You receive your Longevity Book, the document with your starting picture, your priorities and your plan. Every 6-12 months you redo the tests to see what has changed. Not a one-off check-up, but a path that updates on your results.
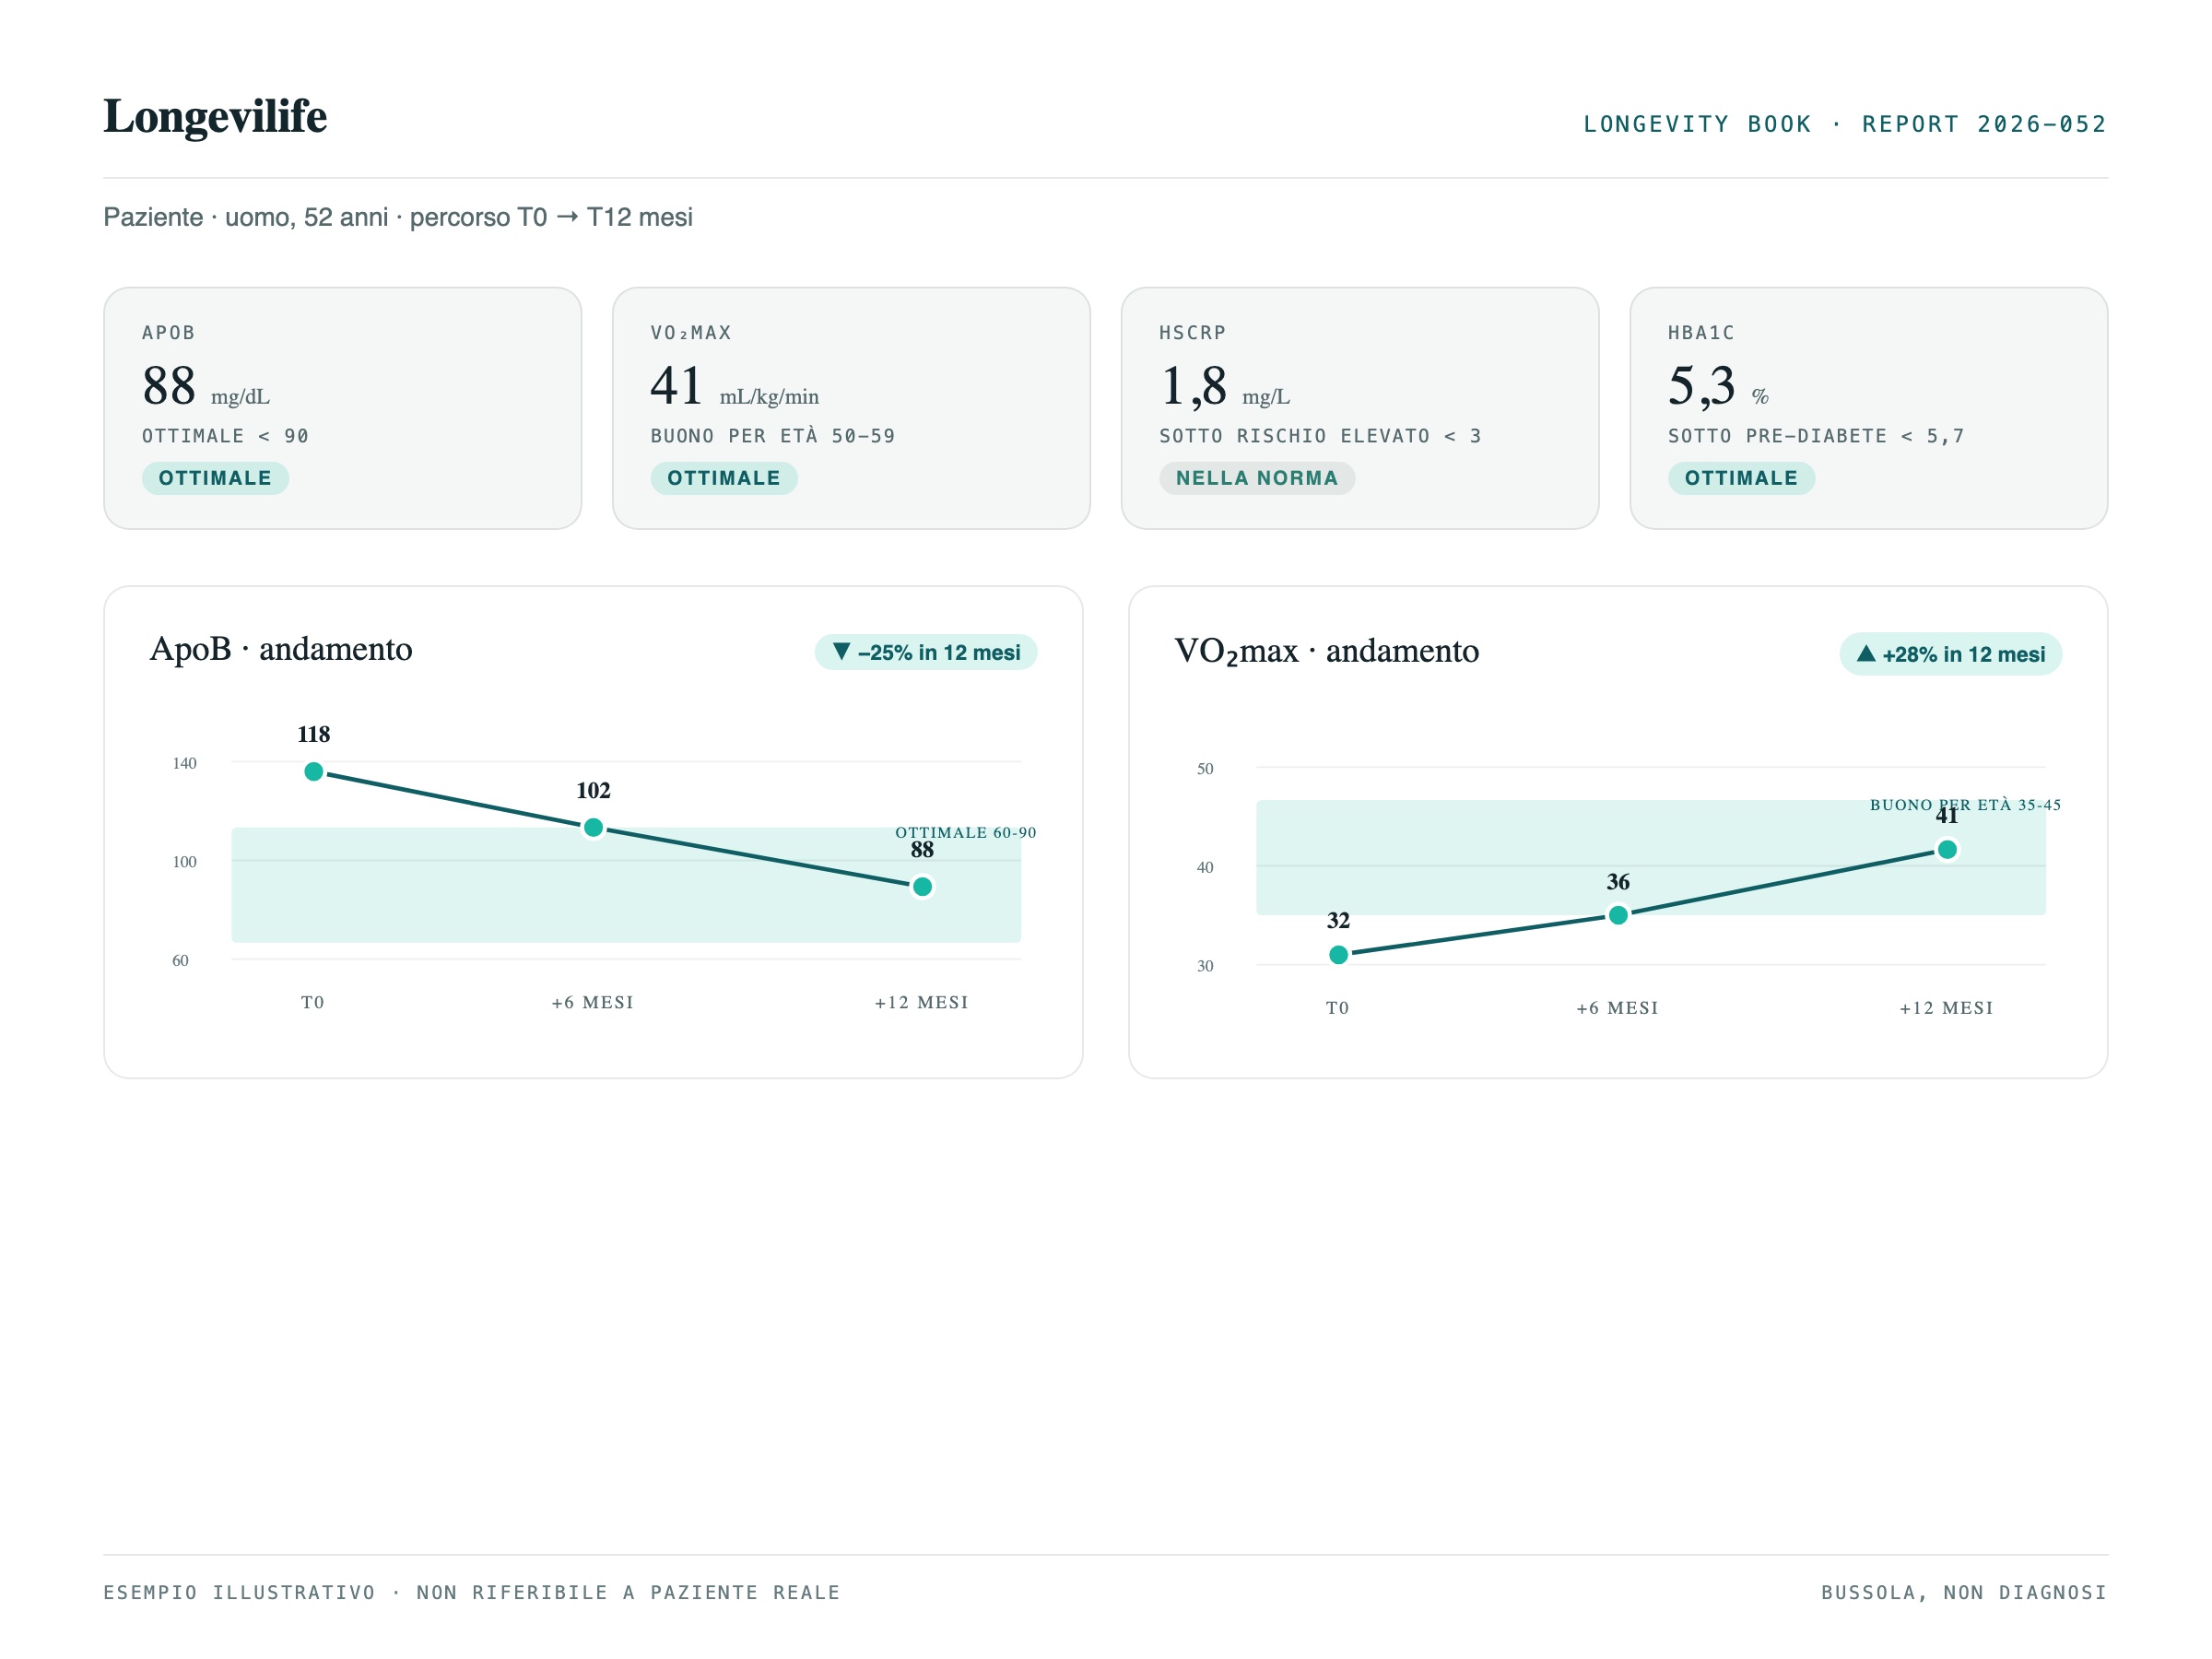
Not a one-off check-up, but a path that updates on your results.
A check-up tells you how you are today. Not what to do tomorrow.
Most tests end up in a PDF and in a drawer: a number without context, a visit without a follow-up. But the value of a data point lies in two things: how you read it in your context, and how it changes over time.
That is why we don’t sell a package of tests: we bring you into a path that repeats and corrects itself.
What happens, step by step
First assessment (measure)
You do a series of advanced tests and functional tests: blood (e.g. ApoB, hsCRP, HbA1c), cardiorespiratory fitness (VO₂max), strength, body composition. It is your starting baseline: we measure what research links to long-term health, not everything that is measurable.
Medical reading (interpret)
A physician reads your data in your context (history, goals, lifestyle) and turns it into clear priorities: what to look at first, what to monitor, what to leave be.
Longevity Book + plan (act)
You receive the Longevity Book: your starting picture, the markers that matter for you, your priorities and the plan (nutrition, movement, supplementation, recovery and, when needed, medical care). It is the document everything starts from, not a report to file away.
Re-test every 6-12 months (re-measure and compare)
After 6-12 months you redo the tests and we compare them with the starting baseline: what improved, what didn’t, what needs correcting. The plan updates on real results, it isn’t written just once.
One-off check-up or the Longevilife method
It isn’t a more sophisticated test: it’s the fact that we don’t leave you with a report. Measurement, reading, plan and re-test are a single thread, and every check compares with the one before.

Not a tool, but a multidisciplinary path in a single day.
Ours isn’t a device that "does everything" on its own, but a path followed by dedicated professionals who read the data in your context and follow you over time. It is proactive prevention: taking charge of the person, updated at every re-test.
- A physician and dedicated professionals contextualise the data: the tool measures, the team interprets.
- Taking charge over time: not a one-off report, but a path that is revised.
- The measures of the path are gathered in the same day at the facility.

First assessment: your starting baseline.
We measure across areas that research solidly links to long-term health. Not everything applies to everyone: the panel is built on your profile.
- Heart and metabolism: ApoB and the lipid and metabolic profile, where the largest share of long-term risk plays out.
- Cardiorespiratory fitness: VO₂max, among the measures most tied to future health, and it can be trained.
- Inflammation and blood sugar: hsCRP and HbA1c, signals that matter well before they become a "diagnosis".
What we measure, concretely
The path goes beyond blood markers: it covers several areas that research links to long-term health. Here is what we measure:
Heart and metabolism
ApoB (the cholesterol particles that can clog arteries) and an in-depth lipid and metabolic profile. It is the system where the largest share of long-term risk plays out.
Cardiorespiratory fitness (VO₂max)
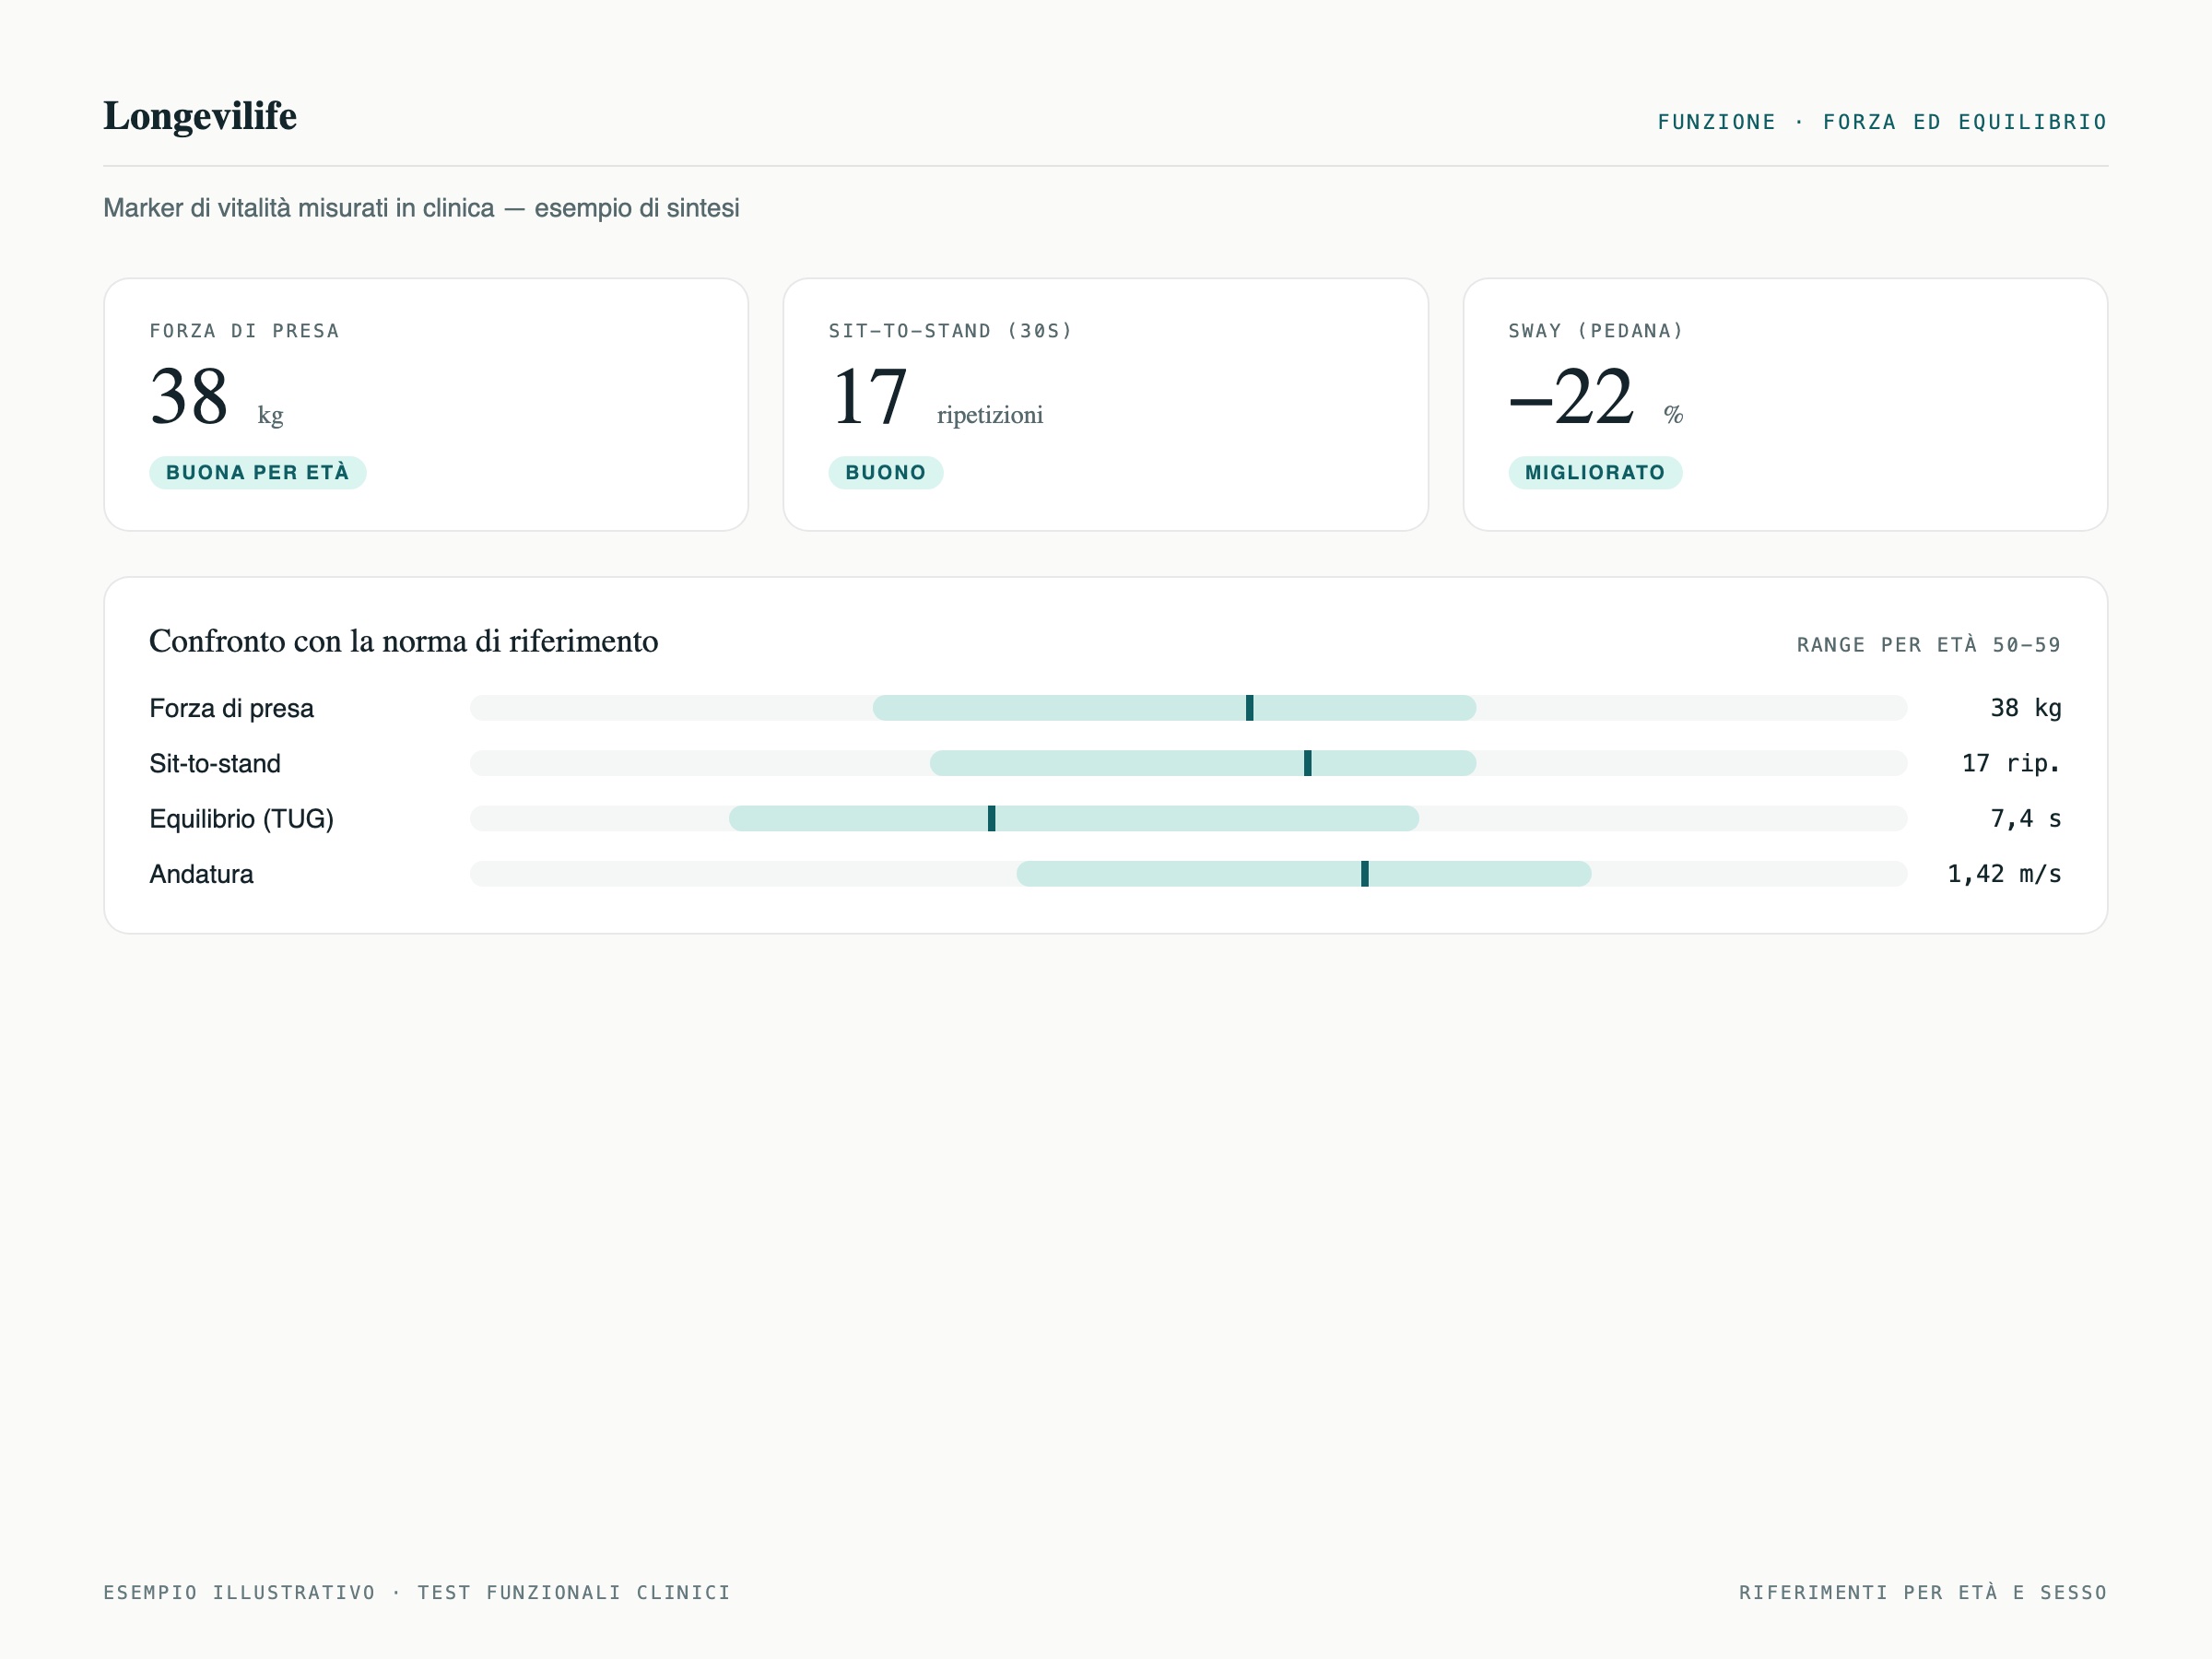
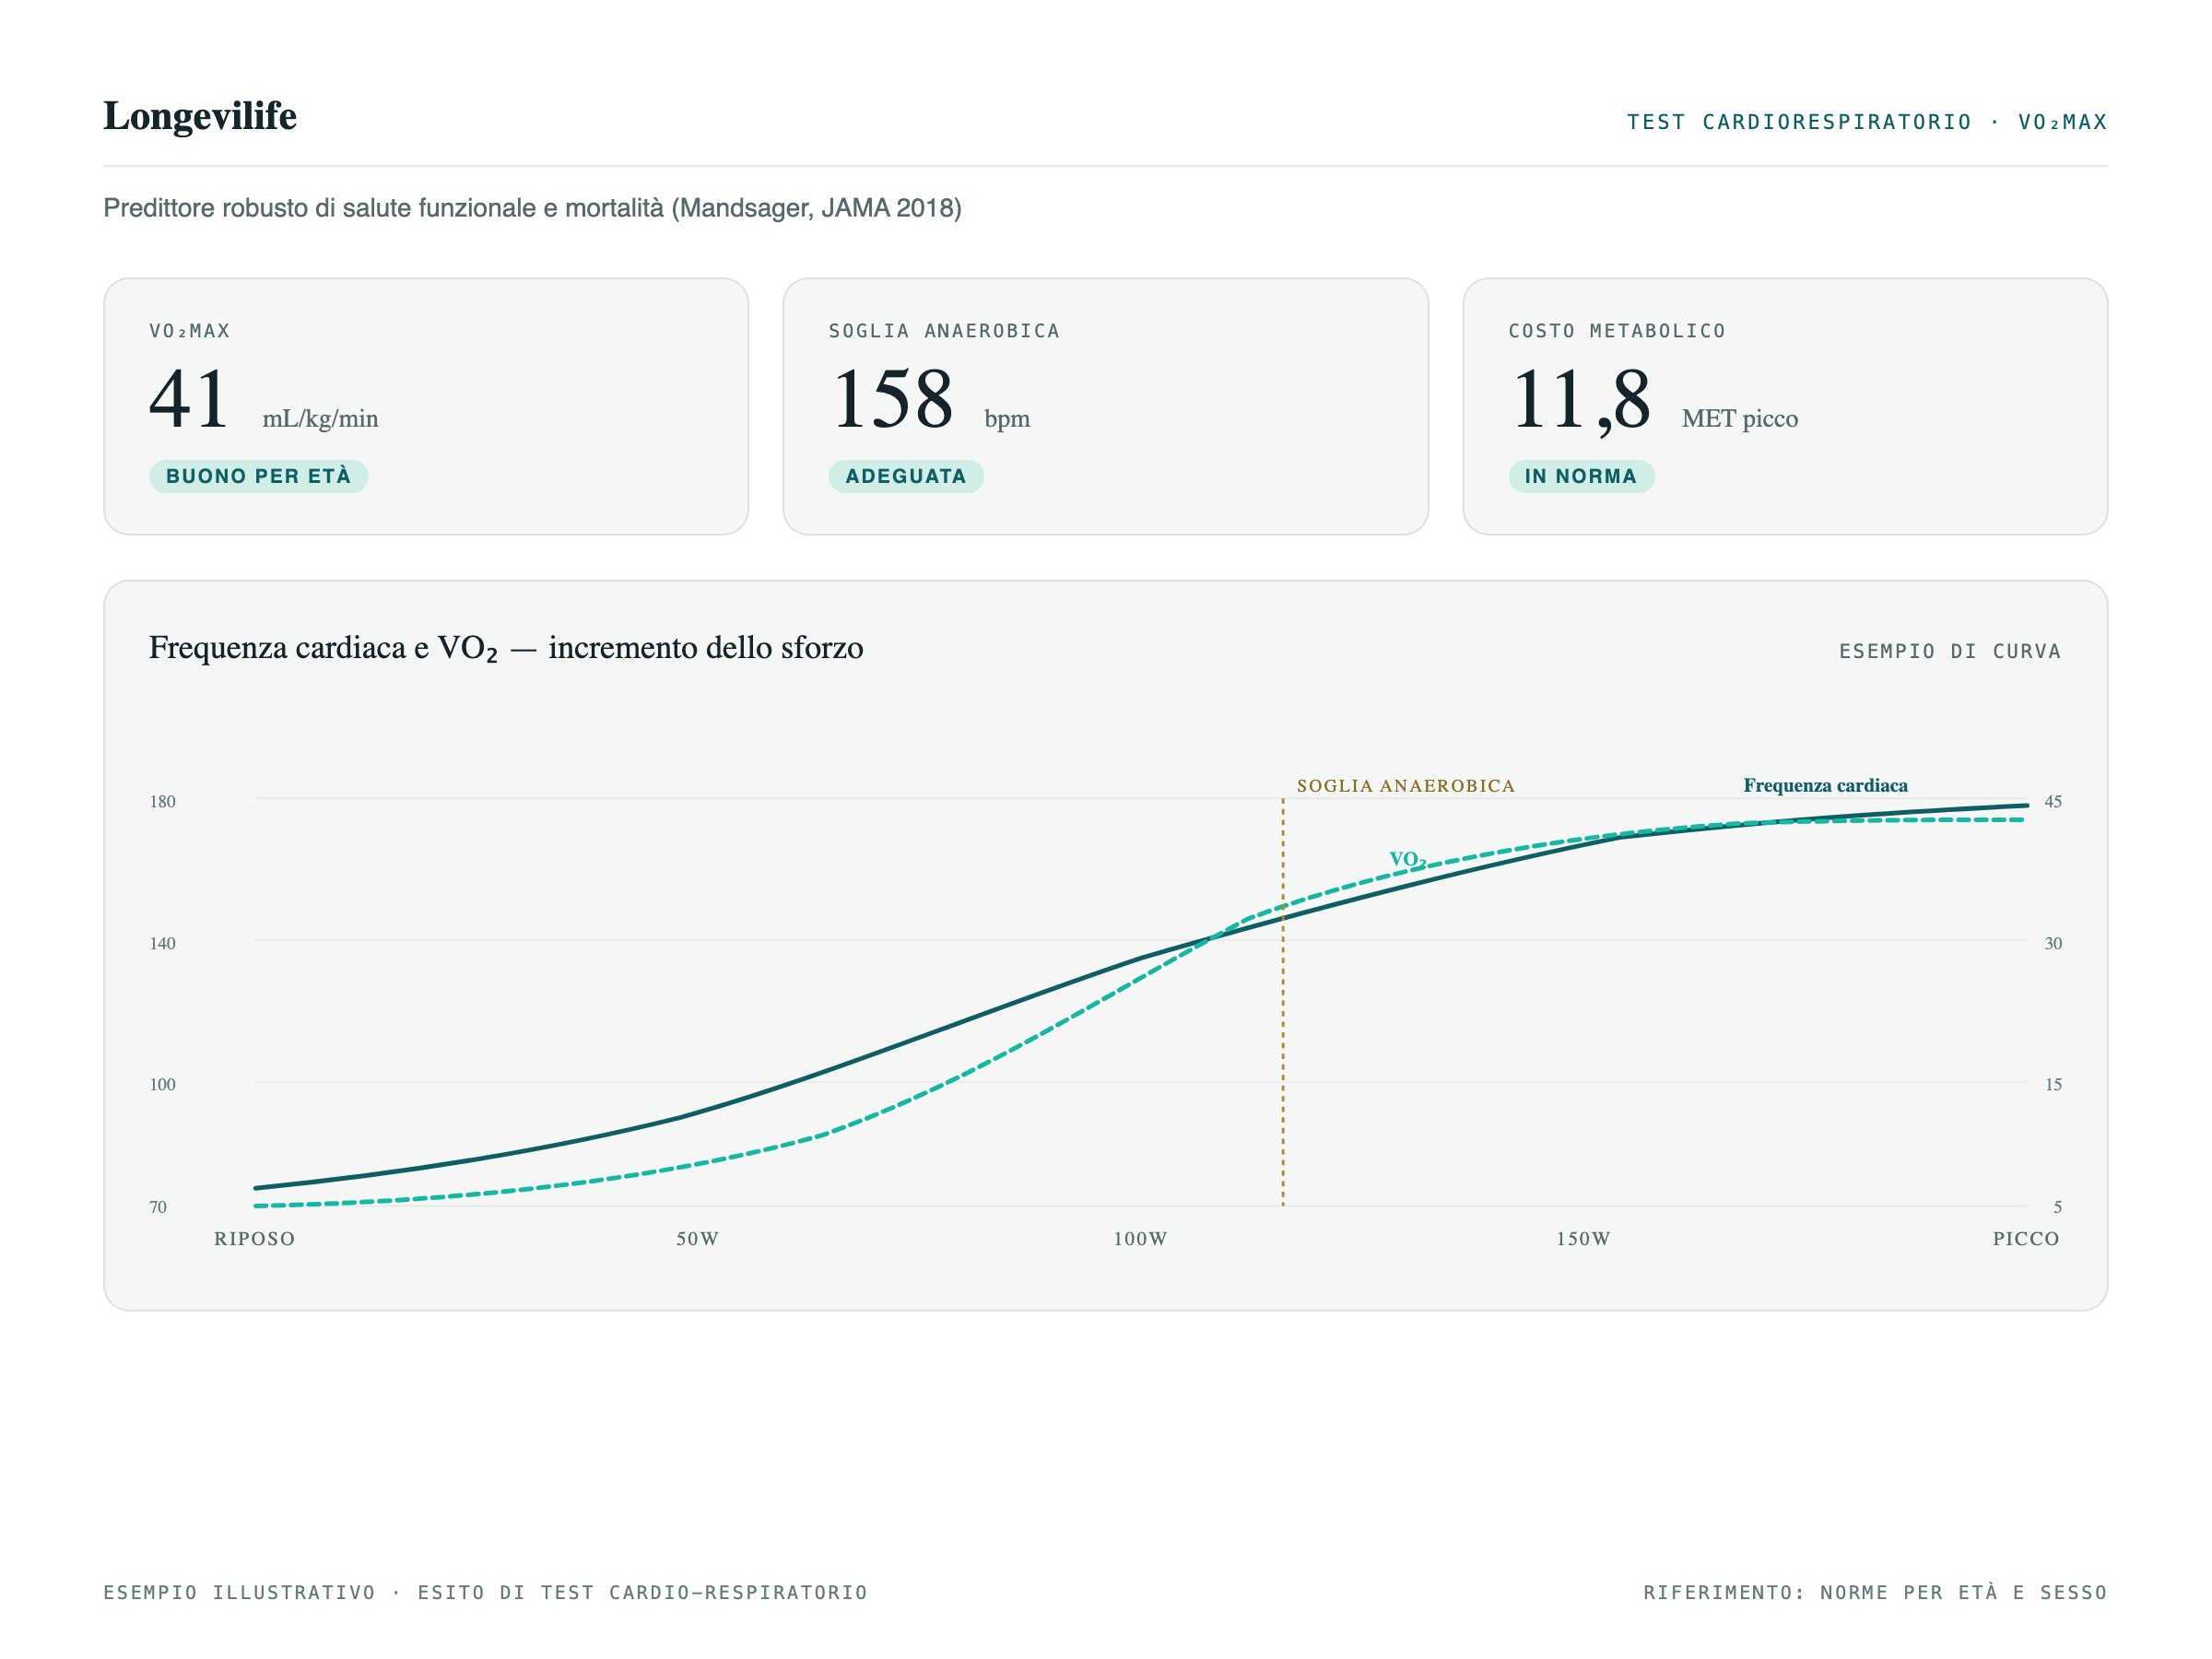
How well heart and muscles produce and use energy under effort. It is among the measures most tied to future health, and it can be trained.
Body composition
The ratio between muscle, fat and structure, including the share of visceral fat (the fat around the organs, more tied to risk) and your muscle reserve, monitored over time.
Inflammation and blood sugar
hsCRP (background inflammation) and HbA1c (the average of your blood sugar over recent months): signals that matter well before they become a "diagnosis".
Ultrasound and diagnostic imaging
Imaging tests such as ultrasound, to look inside the tissues and not stop at the laboratory value.
Genetic and epigenetic predisposition
The predisposition written in the genes and the epigenetic signals (biological age), which we use as monitoring over time, not as a diagnosis.
The panel is personalized: what goes into it is decided by the clinical protocol, case by case. Want to understand why exactly these markers? We explain it on the page The science behind the method.
Every value, relative to its optimal range.
In the Longevity Book every marker is shown like this: where your value falls and where it would be optimal for age and sex. What counts is the reading in context, not the isolated number.
Illustrative example: values and ranges are not real.
A number to orient yourself, inside the Longevity Book.
The Score is part of the Longevity Book. Our synthesis of markers that research and guidelines link to health, expressed as a 0 to 100 score: higher means better values for age and sex. It is a compass, not a diagnosis.
Illustrative example: values are not real.
The plan updates on real results.
At every re-test we compare the data with the starting baseline: what improved, what didn’t, what needs correcting. The plan (nutrition, movement, supplementation, recovery) isn’t written just once.
Every re-test becomes the new starting baseline: the compass stays calibrated to your results.
Everything converges into the Longevity Book, which you receive at the first assessment and which updates at every re-test: your starting picture, the markers that matter for you, your priorities and the plan.
Over time, the history of your data holds together the results that add up, so that every check is read against your personal series, not as an isolated test. The platform that manages it is in development (2026): we describe it in the Intelligence section.
Measuring validated predictors of risk serves to act earlier and better. It is not a guarantee of outcome, nor a promise to live longer. What we can do is give you reliable data, a competent reading and a path that updates. What we don’t promise we say in full.
A predictive biomarker is a measure that studies link to a higher or lower future risk. Knowing you are at risk lets you act earlier, but measuring a predictor (that is, a value that anticipates a risk, to be verified case by case) is not the same thing as a treatment that has shown it can change the outcome. We keep the two things distinct, always.
That is why we speak of markers that measure and predict, not of therapies that cure or rejuvenate.
A monitoring tool, not a diagnosis
Chronological age is the one on your ID card. Biological age estimates how "old" the body is at the molecular level, by reading chemical signals on the DNA (the so-called epigenetic clocks): it can be higher or lower than the chronological one.
- The most recent versions predict mortality and disease better than chronological age.
- There are signals, still to be consolidated, that lifestyle may influence them.
- What counts is the trend over time, not the isolated number of a single measurement.
The evidence below describes the state of the scientific field: these are studies on large populations, not results obtained on our patients. We report them for transparency.
VO₂max and mortality: Mandsager et al., JAMA Network Open, 2018 (over 120,000 people). ApoB and heart attack risk: Marston et al., JAMA Cardiology, 2022. Lp(a) as a causal and hereditary risk factor: Kamstrup et al., JAMA, 2009; Clarke et al., NEJM, 2009. Coronary calcium (CAC): Multi-Ethnic Study of Atherosclerosis (MESA), Peng et al., Circulation, 2021. Grip strength and mortality: UK Biobank, BMJ, 2018 (n ≈ 500,000). Background inflammation (inflammaging): Franceschi et al., 2000 for the concept; cardiovascular risk and statin in the JUPITER study, Ridker et al., NEJM, 2008. Blood sugar (HbA1c) and mortality below the diabetes threshold: Khaw et al., Annals of Internal Medicine, 2004.
Biological age and epigenetic clocks: Horvath, 2013 and Hannum et al., 2013 for the concept; prediction of mortality and disease with PhenoAge (Levine et al., 2018), GrimAge (Lu et al., 2019) and DunedinPACE (Belsky et al., 2022); signals of influenceability from lifestyle in the CALERIE RCT (Waziry et al., Nature Aging, 2023); limits as a non-diagnostic tool in Bell et al., 2019.
- —It is not a diagnosis.It does not replace a physician’s assessment nor identify a disease.
- —It is not a validated biological clock.It is neither a certified biological age test nor a recognised clinical endpoint.
- —It is not a guarantee.A better score does not promise a longer life; a worse score is not a sentence.
- —It is not a comparison between people.It serves to follow you over time, not to rank you against others (even though the reference is your age group and sex).
- —It is not a "magic" number.It is a synthesis of real markers: it is worth as much as the data and the interpretation behind it.
Because a single number, used with honesty, helps to communicate and to motivate, provided you know what it represents. The Score does not add information to the markers that compose it: it sums them up.
For clinical decisions the individual values always count, read by a physician in your context. The Score serves to keep your course, not to drive in the physician’s place.